Anyone fishing the areas around Mull and the sea lochs such as Etive, Sunart and Linnhe will be aware of the limitations of both the paper and electronic charts for the area, as most are based on very limited and old survey data. Widely spaced soundings can make it difficult to visualise the landscape underwater, particularly in unfamiliar territory, and dropping the anchor becomes uncomfortably close to guess-work.
For the last 6 or 7 years I’ve collected my own seabed data using sonar/GPS logs and running these through DrDepth software to create detailed mini-charts. Admittedly part of the reason for doing this is simply that I like maps, whether land or sea based, and I get a kick out of creating my own. However I have found the insight I get to be very useful in areas I fish regularly and I’ve built up a good picture of Loch Etive in particular.
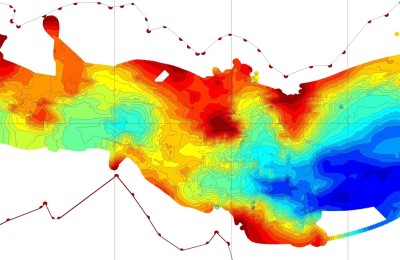
More open water, such as the North Sea, is more difficult to map accurately as wave motion and tidal variations mean that a lot of the detail is lost – it’s still useful, but you are best to survey a small but complete area at a time rather than merge results from different days, and also stick to calm conditions.
Very handily however, a number of recent surveys have been commissioned by the UK Hydrographic Office and the data from these is freely accessible. First off you can get an overview of what’s available here (it looks good, but you can only zoom so far), and secondly you can download the actual survey data itself and run it through charting software such as DrDepth or Reefmaster.
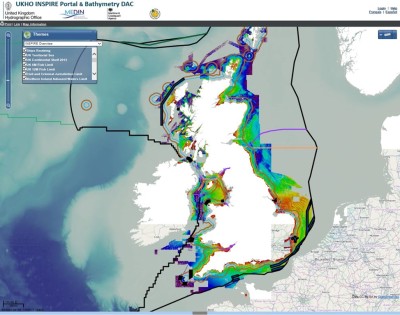
Even the overview can quite clearly show wrecks sitting on the bottom, particularly in areas of sandy bottom such as between Fraserburgh and Aberdeen. The example below shows a small part of a large reef system several miles off Dunbar (with a wreck thrown in for good measure). These are serious lumps of rock, with scours at their base and near vertical walls rising 50-70 feet in places, but relatively few anglers know they are there and they’ve only recently started to appear on charts.

To take another example, if you look at the Isle of Mull you’ll see almost the entire island has been re-surveyed in great detail and there is a lot of interesting information available that simply doesn’t appear on a chart.
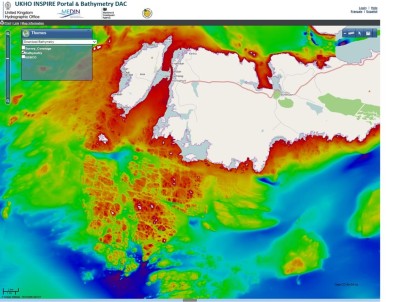
It is hard work, but if you can take it to the next level and download, convert and process the survey data through DrDepth or Reefmaster then you get into a different league in terms of what you can get out. The blurry dot that represents the Halland in the image above can be transformed into a detailed view like that below, where the length, orientation, height of the wreck and a small scour to the south are all clearly visible.
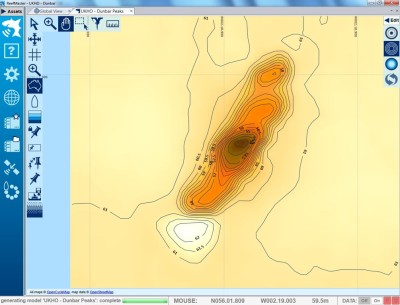
From there it is a relatively small step to generate a “proper” electronic chart that can be loaded in your chart plotter like a Navionics or CMap cartridge – but one that contains much more of the detail you need to see as an angler.
Compared to logging your own data from a sonar log, the UKHO offers much more information and it is also high quality (mostly on a 2 x 2m grid and properly adjusted for wave height, tides, etc,). In a good year I might log 50,000-100,000 data points from the sonar, but UKHO are offering something like 40 million for the area around Mull alone. All available for free download…
This sort of data is somewhat difficult to work with on account on the sheer number of survey points and it’s use of Cartesian positions rather than Lat/Long, but can give a completely new view of areas that conventional charts don’t really display properly. I’m still working through some of the issues myself, but will be updating my charting/DrDepth pages over the next few months.
As an aside it’s worth noting that DrDepth is no longer available for purchase since being bought out by one of the major sonar manufacturers. I’ve been looking at Reefmaster software as a possible replacement, but there are also other solutions such as Insight Genesis (Lowrance). Reefmaster can definitely handle the UKHO datasets, once converted to LatLong formats, but I’m not sure about other software.
p.s. your mileage may vary – survey data available depends on the UKHO’s work programme. I’m lucky because many of the areas I’m interested in have been recently worked over so there is quite a bit of information for my patches.
Share this: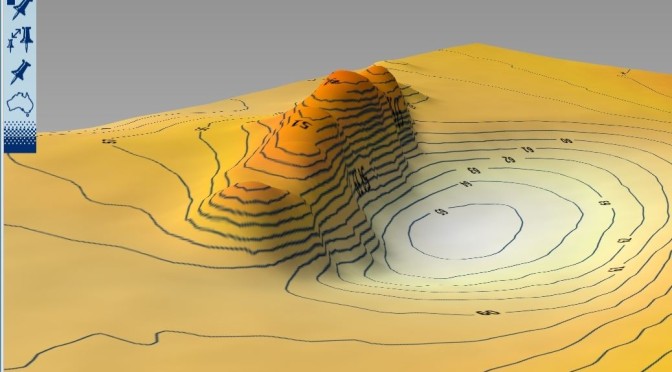
This is a great blog and one to which I often find myself reading as being an aspiring boat owner, an angler and geologist, your exploits cover all my base interests.
The skills you have at uncovering the hidden depth I find particularly fascinating, I have spent several trips with my pal aboard his boat on Lomond and must say that watching the fish finder picking up submerged features is as good as trying to catch the odd perch or pike. The British Geological Survey had a great video on their website showing the underwater relief of Loch Lomond which I’m sure you would find very entertaining if it is still available.
Keep up the great blog.
Cheers,
Andy